Introduction
How I improved my programming language runtime (see sophia) for a specific benchmark by reducing its execution time by 7.03 times or 85%. The benchmark script previously took 22.2 seconds. I reduced it to 3.3s!I started developing the sophia programming language in july 2023 to learn all about lexical analysis, parsing and evaluation in a real world setting. Thus i decided on the (in)famous lisp S-expressions. A very early stage of the project can be seen here.
Currently the syntax is as follows:
 1;; power of n
 2(fun square (_ n)
 3    (* n n))
 4
 5(let n 12)
 6(let res
 7    (square a))
 8(put '{n}*{n} is {res}') ;; 12*12 is 144
 9
10;; fizzbuzz 0-15
11(for (_ i) 15
12    (let mod3 (eq 0 (% i 3)))
13    (let mod5 (eq 0 (% i 5)))
14    (match
15        (if (and mod3 mod5) (put "FizzBuzz"))
16        (if mod3 (put "Fizz"))
17        (if mod5 (put "Buzz"))
18        (put i)))
19
20;; efficient binomial computation
21(fun bin (_ n k)
22    (if (gt k n)
23        (return -1))
24    (if (and (eq k n) (eq k 0))
25        (return 1))
26
27    ;; Due to the symmetry of the binomial coefficient with regard to k and n −
28	;; k, calculation may be optimised by setting the upper limit of the
29	;; product above to the smaller of k and n − k, see
30	;; https://en.wikipedia.org/wiki/Binomial_coefficient#Computing_the_value_of_binomial_coefficients
31    (let kn (- n k))
32    (if (lt kn k)
33        (let k kn))
34
35    ;; see https://en.wikipedia.org/wiki/Binomial_coefficient#Multiplicative_formula
36    (let r 1)
37    (for (_ i) k
38        (let r
39            (/ (* r (- n i)) (+ i 1)))
40        )
41    r)
42
43(put (bin 1 1)) ;; 1
44(put (bin 6 3)) ;; 20
45(put (bin 49 6)) ;; 20
46(put (bin 20 15)) ;; 15504
Tip
In the future i will highlight the part of the implementation responsible for error handling and display - not only because i think its a very interesting topic, but due to me being very proud of the final result. Here a small sneak peek.
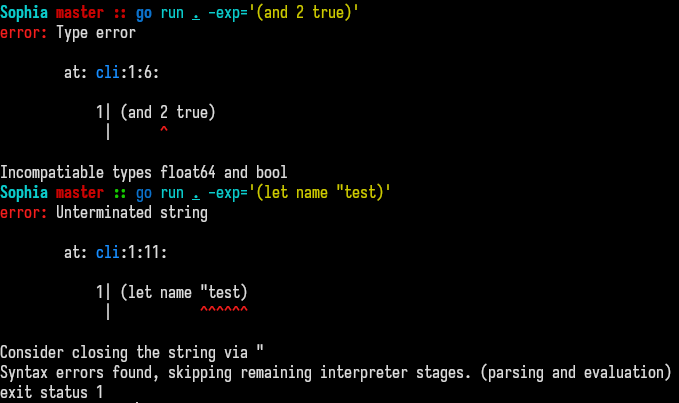
If you’re interested in a more extensive overview, visit Sophia - Internal Documentation - Error Handling.
Lets Talk Architecture
The interpreter follows the same rudimentary stages of interpretation most interpreters make use of:
- Lexical analysis: character stream to token stream
- Parsing: token stream to abstract syntax tree
- Evalulation: abstract syntax tree to values (Tree walk interpreter)
I did not develop the interpreter with performance in mind.
Tip
Both the lexer and the parser do not really do that much, thus i focus on the evaluation stage of the interpreter in this blog post.AST and Eval
The evaluation is the most interesting part of the interpreter, I chose the Interpreter pattern - simply because it was the first time I was implementing an interpreter.
The AST in sophia consists of Node’s that can contain child Node’s. The
evaluation process starts at the root of the AST and dispatches a
Node.Eval() call. The root node dispatches this call to its children and its
children to their children, thus walking the tree and moving the work to the
Node’s:
 1// expr/node.go
 2type Node interface {
 3    // [...]
 4    Eval() any
 5}
 6
 7// expr.String statisfies expr.Node
 8type String struct {
 9    Token token.Token
10}
11
12func (s *String) Eval() any {
13    return s.Token.Raw
14}
15
16// expr.Put dispatches a .Eval call
17// to each of its child nodes
18type Put struct {
19    Token    token.Token
20    Children []Node
21}
Due to the interpreter holding all token, all ast nodes and possibly walking
and calling Eval() on most of them multiple times, the memory and cpu
footprint is large for a minimal language like this. This can be mitigated
with reworking the evaluation into a byte code compiler and vm.
Benchmarking
The real problem is that programmers have spent far too much time worrying about efficiency in the wrong places and at the wrong times; premature optimization is the root of all evil (or at least most of it) in programming.
Donald E. Knuth, Turing Award Lecture (1974)
The first step in the process of optimisation is to know where to look. I didn’t have any previous experience with benchmarks and interpreter performance - therefore I did the only responsible thing and fired up a profiler.
Example benchmark
Before we do that we want to quickly hack up a script using a big enough set of the instructions of our programming language that takes long enough for us to gain an insight on whats going on inside the interpreter. I chose a leetcode problem and want to execute it around 500k times - this should really give us a big enough of a sample.
 1;; leetcode 327 Maximum Count of positive integer and negative integer
 2(let example1
 3    (not 2) ;; negated: (not 2) -> -2
 4    (not 1)
 5    (not 1) 1 2 3)
 6(let example2 (not 3) (not 2) (not 1) 0 0 1 2)
 7(let example3 5 20 66 1314)
 8
 9;; returns a if bigger than b, otherwise b
10;; max: float, float -> float
11(fun max (_ a b)
12    (let max a) ;; created as nil
13    (if (lt a b) (let max b))
14    max) ;; return without extra statement
15
16;; counts negative and positve numbers in arr, returns the higher amount
17(fun solve (_ arr)
18    (let pos 0)
19    (let neg 0)
20    (for (_ i) arr
21        (match
22            (if (lt i 0) (let pos (+ pos 1)))
23            (let neg (+ neg 1))))
24    (max neg pos))
25
26
27(for (_ i) 500_000
28    (solve example1) ;; 3
29    (solve example3) ;; 4
30    (solve example2) ;; 4
31)
Naive first estimates
Executing this on my machine without any optimizations applied takes a whooping 6.5s:

Anyway, lets start setting up the profiler.
Project and Profiler setup
Tip
This is somewhat of a guide to setting up a go project and running a profiler with the application. You can follow along if your want :^).Lets first clone the repo and move back in git history untill we are before the optimizations took place:
1git clone https://github.com/xnacly/sophia oldsophia
2cd oldsophia
3git reset --hard 024c69d
Lets modify our application to collect runtime metrics via the runtime/pprof package:
 1// oldsophia/main.go
 2package main
 3
 4import (
 5	"os"
 6	"runtime/pprof"
 7	"sophia/core/run"
 8)
 9
10func main() {
11	f, err := os.Create("cpu.pprof")
12	if err != nil {
13		panic(err)
14	}
15	pprof.StartCPUProfile(f)
16	defer pprof.StopCPUProfile()
17
18	run.Start()
19}
The next step is to compile, run and start the profile of our application with the example benchmark script we created before:
1$ go build.
2$ ./sophia leetcode.phia
3$ go tool pprof -http=":8080" ./sophia ./cpu.pprof
We are not interested in the graph view, so lets switch to Top.
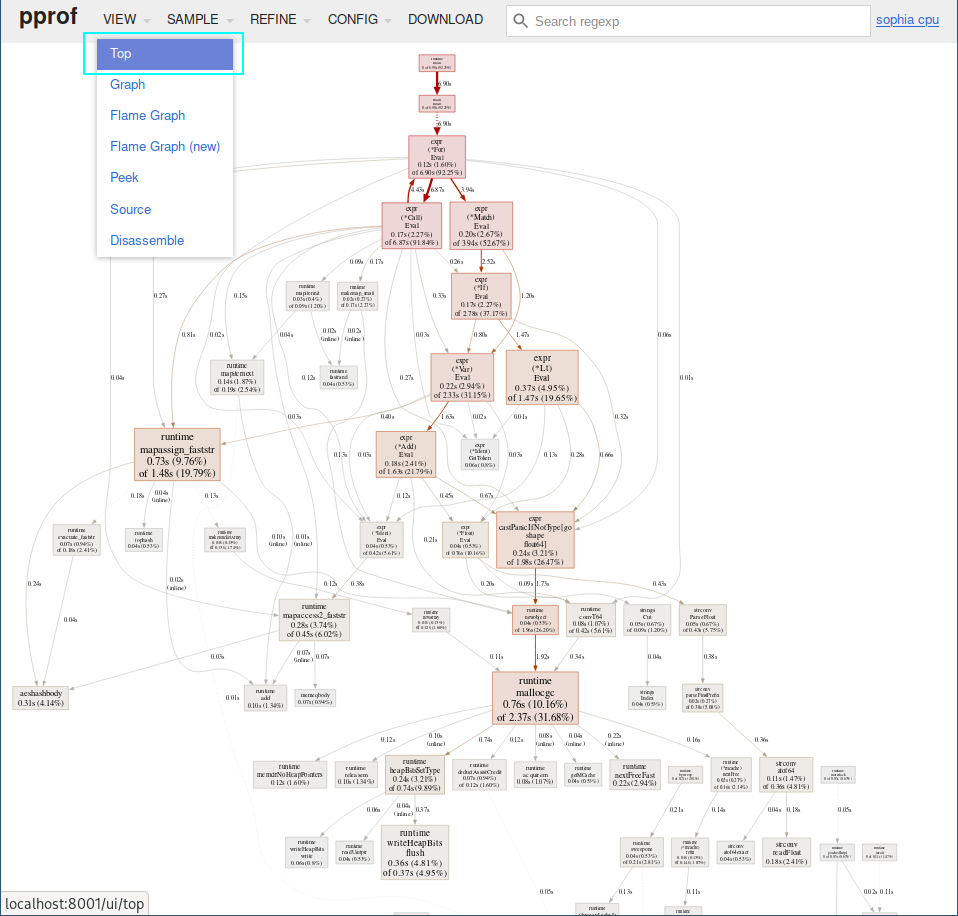
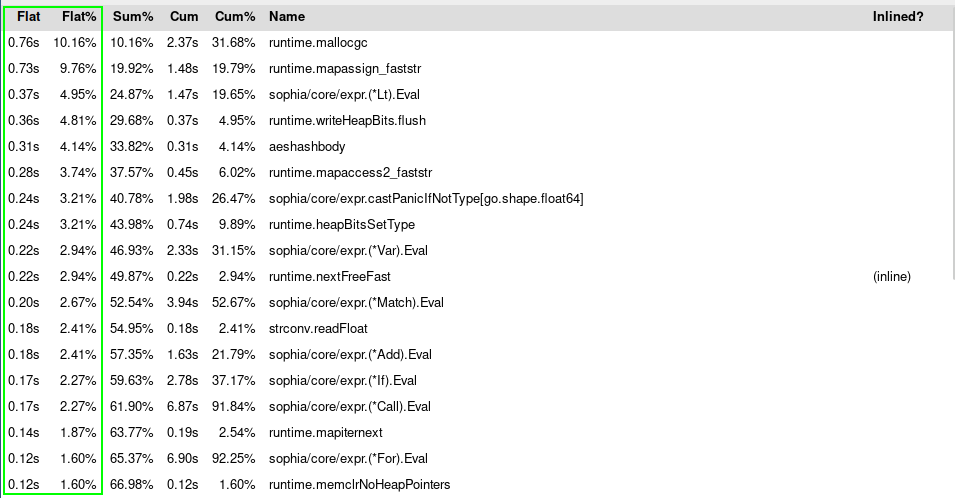
The most interesting for us in this new view are the Flat and Flat% columns:
Archiving Easy Performance Gains
Doing less is more (performance)
Especially in hot paths, such as nodes that are accessed or evaluated a lot, reducing the amount of instructions or operations is crucial to improving performance.
Constant parsing
Previously both expr.Boolean & expr.Float did heavy operations on each
Eval() call:
 1func (f *Float) Eval() any {
 2	float, err := strconv.ParseFloat(f.Token.Raw, 64)
 3	if err != nil {
 4		serror.Add(&f.Token, "Float parse error", "Failed to parse float %q: %q", f.Token.Raw, err)
 5		serror.Panic()
 6	}
 7	return float
 8}
 9
10func (b *Boolean) Eval() any {
11	return b.Token.Raw == "true"
12}
Both these functions can and will be executed multiple times throughout running a script, thus computing these values at parse time improves performance be reducing operations in hot paths.
 1// core/parser/parser.go:
 2func (p *Parser) parseArguments() expr.Node {
 3    // [...]
 4	} else if p.peekIs(token.FLOAT) {
 5		t := p.peek()
 6		value, err := strconv.ParseFloat(t.Raw, 64)
 7		if err != nil {
 8			serror.Add(&t, "Failed to parse number", "%q not a valid floating point integer", t.Raw)
 9			value = 0
10		}
11		child = &expr.Float{
12			Token: t,
13			Value: value,
14		}
15        //[...]
16	} else if p.peekIs(token.BOOL) {
17		child = &expr.Boolean{
18			Token: p.peek(),
19			// fastpath for easy boolean access, skipping a compare for each eval
20			Value: p.peek().Raw == "true",
21		}
22	}
23    // [...]
24}
25
26// core/expr/float.go:
27type Float struct {
28	Token token.Token
29	Value float64
30}
31
32func (f *Float) Eval() any {
33	return f.Value
34}
35
36// core/expr/bool.go:
37type Boolean struct {
38	Token token.Token
39	Value bool
40}
41
42func (b *Boolean) Eval() any {
43	return b.Value
44}
Type casts!?
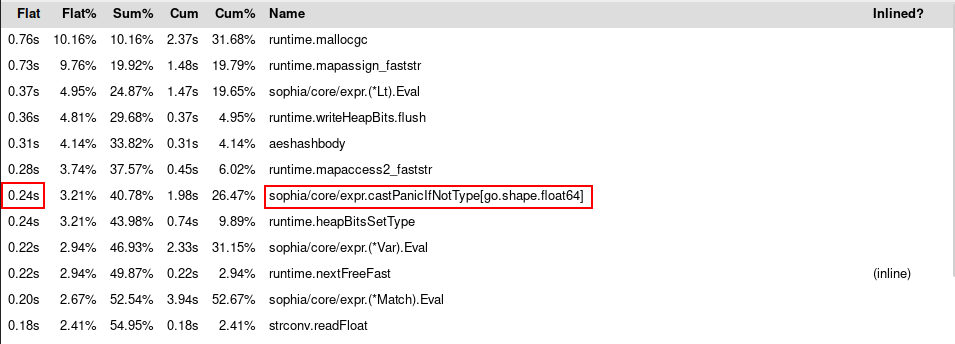
A prominent function in the profiler output is core/expr.castPanicIfNotType,
which is a generic function and in this case present for float64:
The implementation for castPanicIfNotType is as follows:
1func castPanicIfNotType[T any](in any, t token.Token) T {
2	val, ok := in.(T)
3	if !ok {
4		var e T
5		serror.Add(&t, "Type error", "Incompatiable types %T and %T", in, e)
6		serror.Panic()
7	}
8	return val
9}
This function increases the load on the garbage collector because val is
almost always escaping to the heap. I tried mitigate the need for a generic
function by implementing two helper functions for casting to bool and to
float64, both functions make use of type switches and proved to be faster /
being not represented in the top 15 of the profiler:
 1// fastpath for casting bool, reduces memory allocation by skipping allocation
 2func castBoolPanic(in any, t token.Token) bool {
 3	switch v := in.(type) {
 4	case bool:
 5		return v
 6	default:
 7		serror.Add(&t, "Type error", "Incompatiable types %T and bool", in)
 8		serror.Panic()
 9	}
10	// technically unreachable
11	return false
12}
13
14// fastpath for casting float64, reduces memory allocation by skipping allocation
15func castFloatPanic(in any, t token.Token) float64 {
16	switch v := in.(type) {
17	case float64:
18		return v
19	default:
20		serror.Add(&t, "Type error", "Incompatiable types %T and float64", in)
21		serror.Panic()
22	}
23	// technically unreachable
24	return 0
25}
Resulting benchmark and pprof
Putting these optimisation together, rebuilding and rerunning the app + profiler results in our new top 15 functions we can use for optimising the interpreter further:
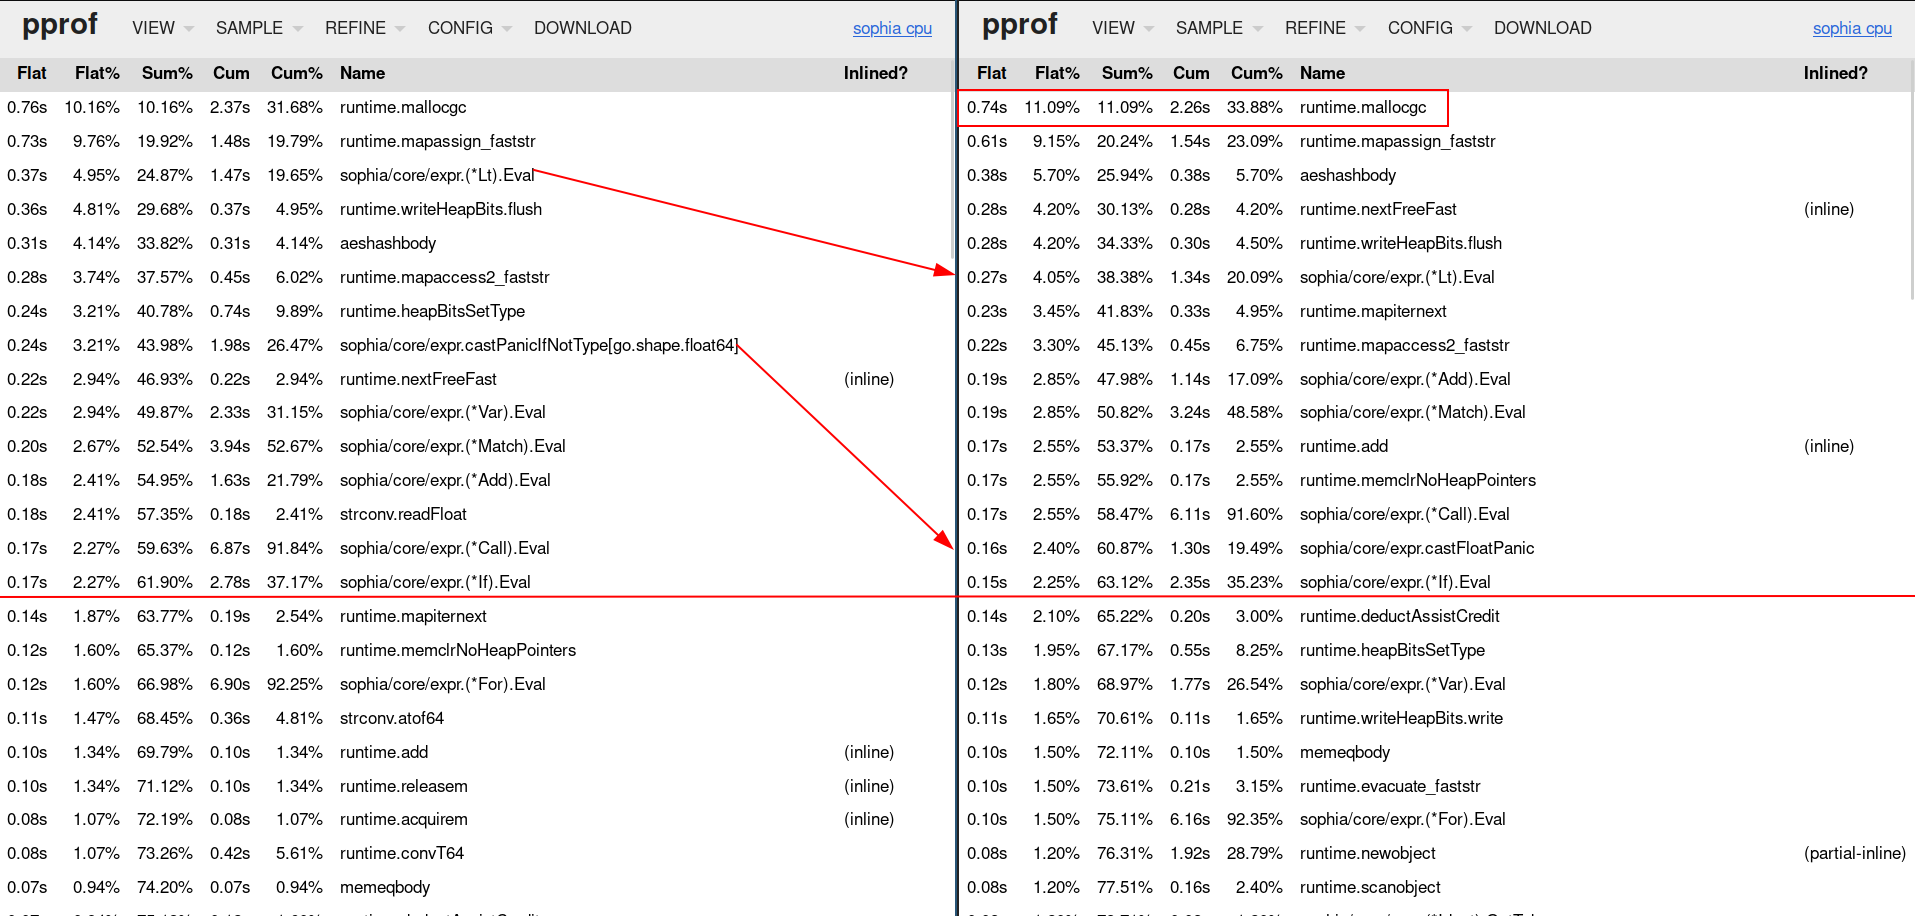
We reduced the time castPanicIfNotType took from 0.24s to 0.16s, furthermore
we reduced expr.(*Lt).Eval from 0.37s to 0.27s. Our big issue with garbage
collection (red square at the top right) still remains.
We started of with a hyperfine naive benchmark for total time taken to run the script, thus I will continue comparing via the profiler and hyperfine:

Our easy to implement changes already decreased the runtime by ~750ms from 6.553s to 5.803s in comparison to the not optimised state.
Less Easy Performance Gains
Less allocations, less frees
The most eye-catching function is definitely the runtime.mallocgc function.
Our program spends 0.76s of its whole execution allocating memory - Remember we
are writing an interpreter, the lexical analysis and the parser are creating a
lot of memory.
Currently each AST node stores a copy of its token, this could be a potential cause for massive allocation activities, simply due to the fact that we have a lot of tokens and AST nodes.
1type Float struct {
2    // copied by the parser, essentially duplicating GC load
3	Token token.Token
4	Value float64
5}
Our first optimization is therefore to stop copying tokens into AST nodes and
instead keep references to them. Theoretically we should reduce the amount of
memory for the garbage collector to allocate and free from n^2 to n, where
n is the amount of tokens * the size of a token:
1type Float struct {
2	Token *token.Token
3	Value float64
4}
This optimization took some time to implement, I had to rewrite parts of the parser and all expression definitions.
Fast paths
Tip
Fast paths in interpreter or compiler design commonly refers to a shorter path of instructions or operations to get to the same result, see Fast path - wikipedia.The sophia language contains a whole lot of instructions that accept two or more instructions, such as:
- addition
- subtraction
- division
- multiplication
- modulus
- and
- or
- equal
expr.Add and the other above expressions were implemented by simply iterating
the children of the node and applying the operation to them:
 1func (a *Add) Eval() any {
 2	if len(a.Children) == 0 {
 3		return 0.0
 4	}
 5	res := 0.0
 6	for i, c := range a.Children {
 7		if i == 0 {
 8			res = castFloatPanic(c.Eval(), a.Token)
 9		} else {
10			res += castFloatPanic(c.Eval(), a.Token)
11		}
12	}
13	return res
14}
The new and improved way includes checking if there are two children, thus being able to apply the operation for the two children directly:
 1func (a *Add) Eval() any {
 2	if len(a.Children) == 2 {
 3		// fastpath for two children
 4		f := a.Children[0]
 5		s := a.Children[1]
 6		return castFloatPanic(f.Eval(), f.GetToken()) + castFloatPanic(s.Eval(), s.GetToken())
 7	}
 8
 9	res := 0.0
10	for i, c := range a.Children {
11		if i == 0 {
12			res = castFloatPanic(c.Eval(), c.GetToken())
13		} else {
14			res += castFloatPanic(c.Eval(), c.GetToken())
15		}
16	}
17	return res
18}
Reinvent the wheel (sometimes)
This is an optimization that i could not exactly measure, but I knew having to
parse a format string for each put instruction is too heavy of an operation:
 1func (p *Put) Eval() any {
 2	b := strings.Builder{}
 3	for i, c := range p.Children {
 4		if i != 0 {
 5			b.WriteRune(' ')
 6		}
 7		b.WriteString(fmt.Sprint(c.Eval()))
 8	}
 9	fmt.Printf("%s\n", b.String())
10	return nil
11}
Thus I not only removed the fmt.Printf call but also wrapped it for common prints:
 1func (p *Put) Eval() any {
 2	buffer.Reset()
 3	formatHelper(buffer, p.Children, ' ')
 4	buffer.WriteRune('\n')
 5	buffer.WriteTo(os.Stdout)
 6	return nil
 7}
 8
 9// core/expr/util.go
10func formatHelper(buffer *bytes.Buffer, children []Node, sep rune) {
11	for i, c := range children {
12		if i != 0 && sep != 0 {
13			buffer.WriteRune(sep)
14		}
15		v := c.Eval()
16		switch v := v.(type) {
17		case string:
18			buffer.WriteString(v)
19		case float64:
20			buffer.WriteString(strconv.FormatFloat(v, 'g', 12, 64))
21		case bool:
22			if v {
23				buffer.WriteString("true")
24			} else {
25				buffer.WriteString("false")
26			}
27		default:
28			fmt.Fprint(buffer, v)
29		}
30	}
31}
This new function omits the need for parsing format strings, calling to the
runtime to use reflection for simple cases such as strings, float64 and
booleans. The same formatHelper function is reused for format strings.
Resulting benchmark and pprof
Again we restart the profiler and check our top 15 functions:
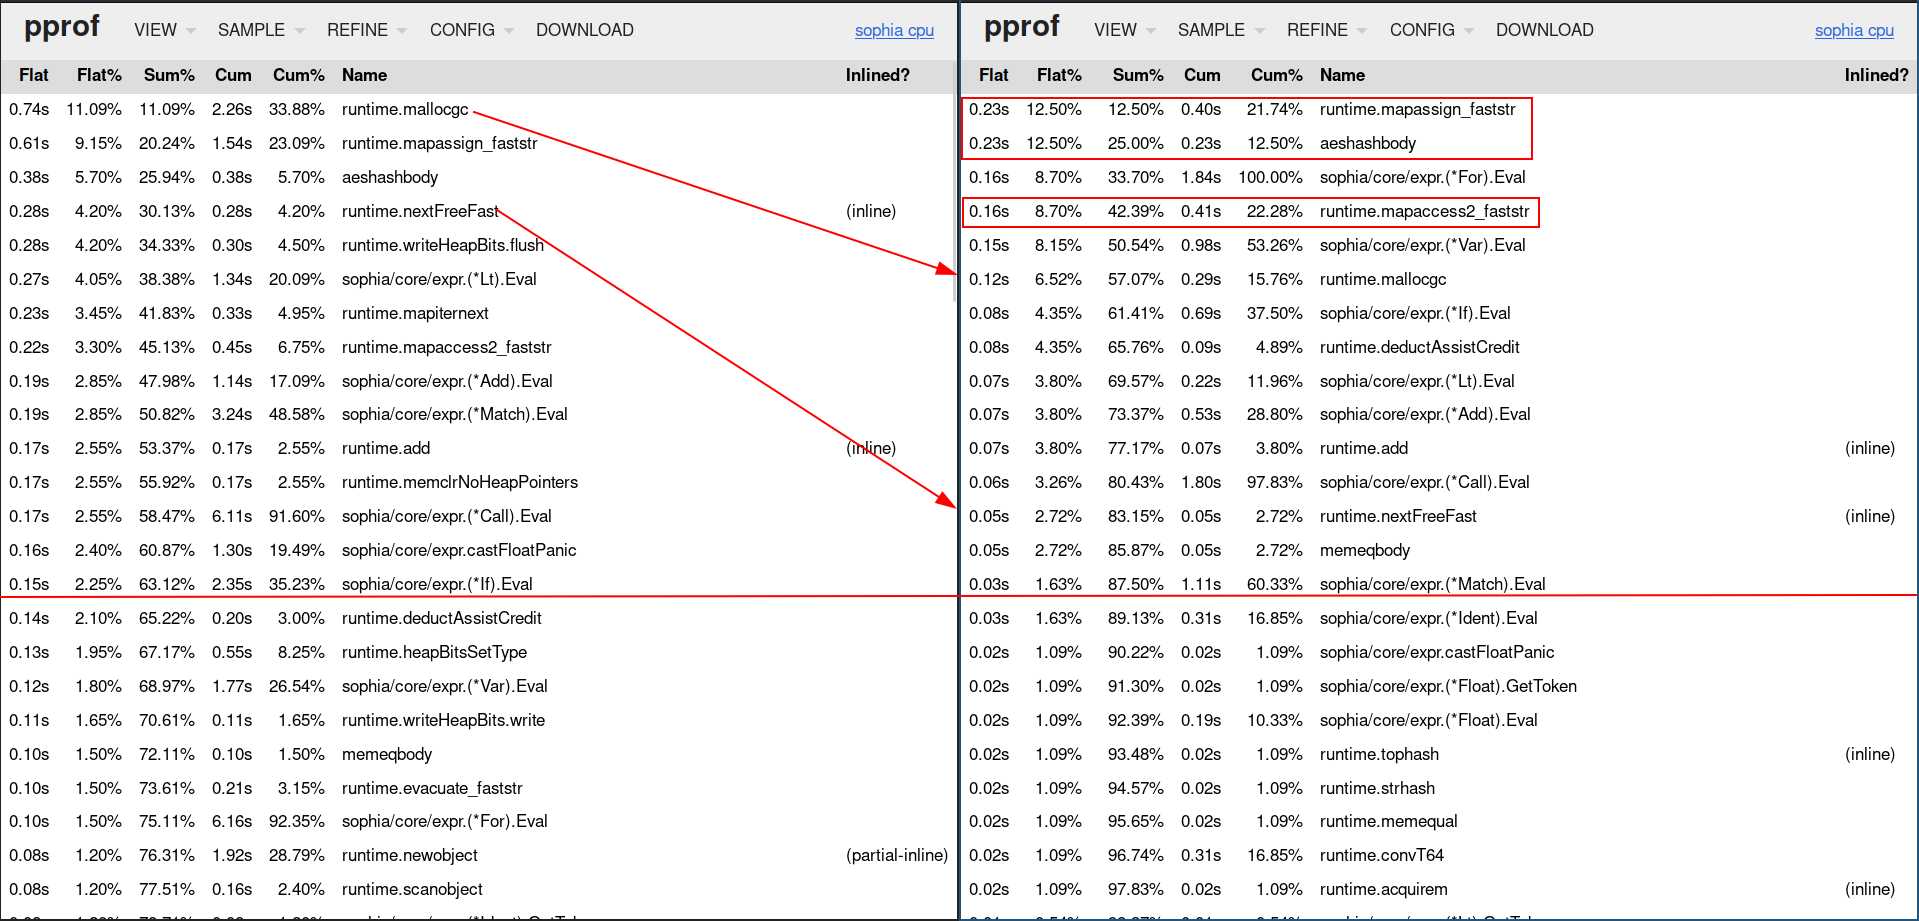
We moved runtime.mallocgc and runtime.nextFreeFast down by a whole lot, the
first from 0.74s of the application run time to 0.12s, the second from 0.28s to
0.05s.

Our slightly less easy to implement changes decreased the runtime by 3.795s from 5.803s to 2.009s in comparison to the not optimised state - that is really good, really really good, we are talking a 65.38% runtime decrease.
A tale of hash table key performance
Our last optimization requires an introduction. The sophia programming language
stores all user defined variables in a map called consts.SYMBOL_TABLE and all
user defined functions in consts.FUNC_TABLE. Both are maps using strings as
keys.
1var FUNC_TABLE = make(map[string]any, 16)
2var SYMBOL_TABLE = make(map[string]any, 64)
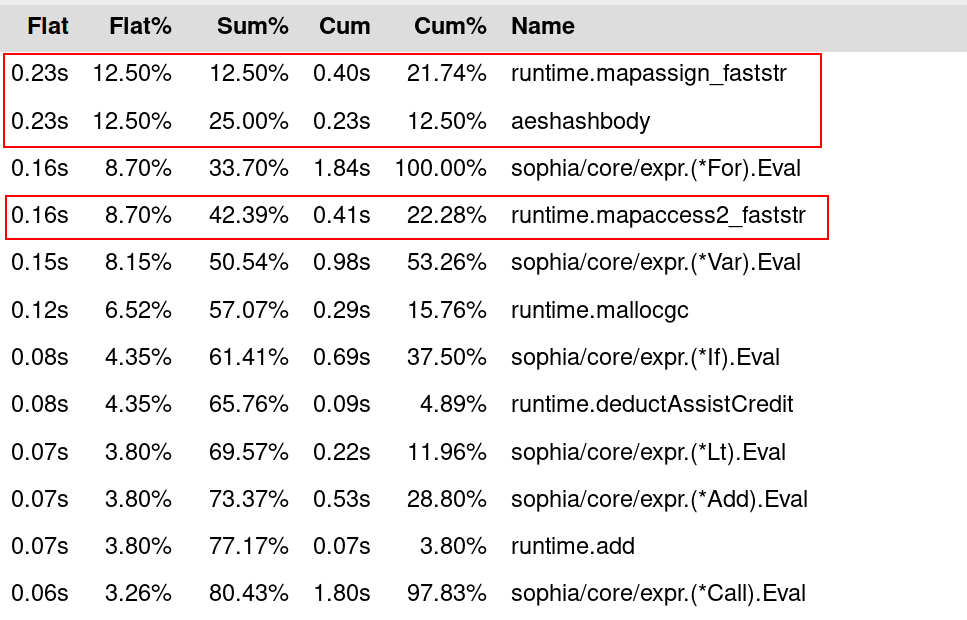
Map key hashing is so expensive the program spends 0.23s/12.5% of its total
runtime on assigning keys to a map (runtime.mapassign_faststr), 0.23s/12.5%
on hashing strings (runtime.aeshashbody) and 0.16s/8.7% on accessing maps
(runtime.mapaccess2_faststr). Cumulated these add up to 0.62s or 33.7% of the
application runtime, thus definitely worth investigating.
Hashing strings with for example
FNV-1a
is as expensive as the string is long, because the hash has to take every
character into account. Integers are inherently easier to hash and therefore
require less computational effort. This prompted me to test if the maps would
perform better with uint32 as keys.
Replacing this was hard, because I had to find a way of keeping track of unique variables and functions while assigning them an identifier (this of course had to be more efficient than strings as keys for maps).
I solved this by creating the
sophia/core/alloc
package and hooking it up to the parser. This package keeps track of variables,
functions and their unique id while parsing. While evaluating, the map access
for identifiers is done with their new fields called Key the parser fills
with the help of the alloc package:
 1// core/expr/ident.go
 2type Ident struct {
 3	Token *token.Token
 4	Key   uint32
 5	Name  string
 6}
 7
 8func (i *Ident) Eval() any {
 9	val, ok := consts.SYMBOL_TABLE[i.Key]
10	if !ok {
11		serror.Add(i.Token, "Undefined variable", "Variable %q is not defined.", i.Name)
12		serror.Panic()
13	}
14	return val
15}
16
17// core/parser/parser.go
18func (p *Parser) parseStatement() expr.Node {
19    // [...]
20    case token.LET:
21		if len(childs) == 0 {
22			serror.Add(op, "Not enough arguments", "Expected at least one argument for variable declaration, got %d.", len(childs))
23			return nil
24		}
25		ident, ok := childs[0].(*expr.Ident)
26		if !ok {
27			serror.Add(childs[0].GetToken(), "Wrong parameter", "Expected identifier, got %T.", childs[0])
28			return nil
29		}
30		if _, ok := alloc.Default.Variables[ident.Name]; !ok {
31			ident.Key = alloc.NewVar(ident.Name)
32		}
33		stmt = &expr.Var{
34			Token: op,
35			Ident: ident,
36			Value: childs[1:],
37		}
38}
Resulting benchmark and pprof
Tip
Hashing seems to be a lot faster on my beefy computer, the benchmarks from my macbook resulted in the following:
Map key hashing for string is expensive, the program spends 1.03s of its
execution (20.93%) in the function aeshashbody, 0.62s in
runtime.mapassign_faststr (12.6%) and 0.46s in runtime.mapaccess2_faststr
(9.35%). Moving from strings to uint32 for map keys replaced these with
spending 0.62s in runtime.memhash32 (15.7%), 0.31s in runtime.mapassign_fast32
(7.85%) and 0.36s in runtime.mapaccess2_fast32 (9.11%). The cumulated map
interactions previously took 3.11s (42.88%) of the total execution time. With
the key change from string to uint32, the total map interaction time went down
to 1.29s (32.66%).
So lets benchmark this drastic change and take a look what happened in comparison to the previous change:
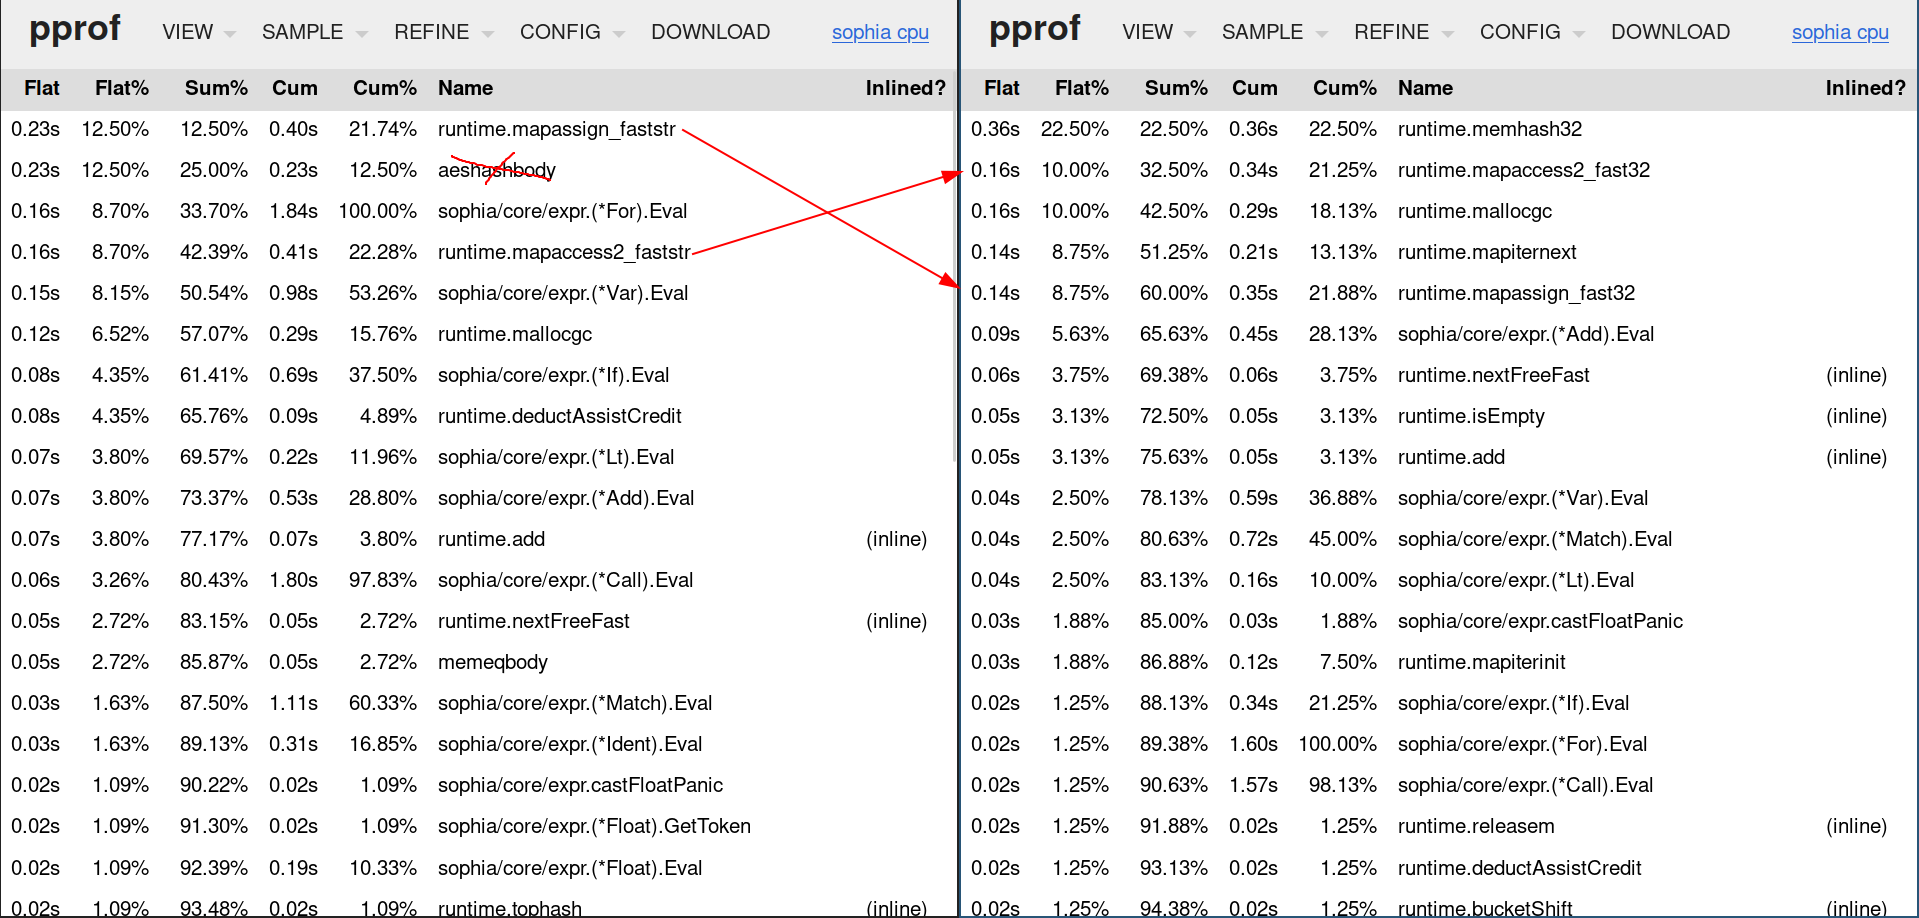
We replaced the expensive map access via string keys and replaced them with
their respective 32 variants. This changed the cumulated amount of
application runtime for map access from previously 0.62s or 33.7% to 0.66s or
40%, however our hyperfine benchmark tells us we decreased the total runtime by
~400ms from previously 2s to 1.6s:

Final benchmarks
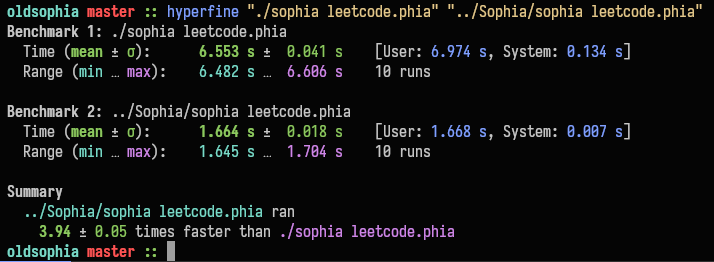
Lets compare the previous stage with the optimised stage of the project via hyperfine:
Pc Specs
Hit em with the neofetch:
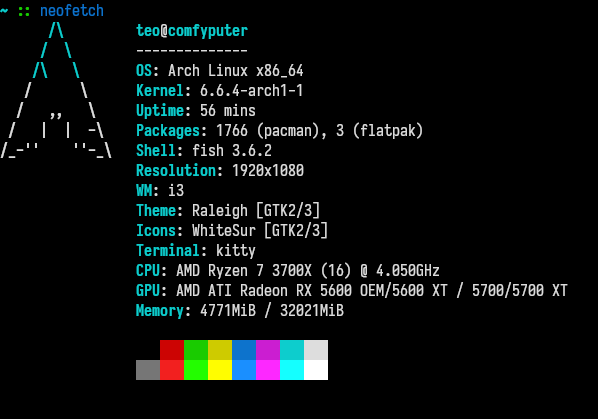
This of course being my beefy machine, if I run the same benchmark on my macbook from 2012, I mainly develop on while in university (and i first ran the benchmark on), the delta is a lot more impressive:
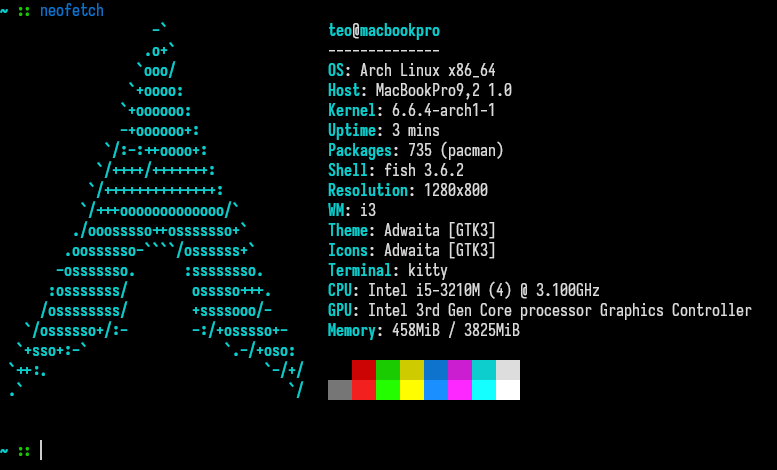
Macbook Specs
Hit em with the (second) neofetch:
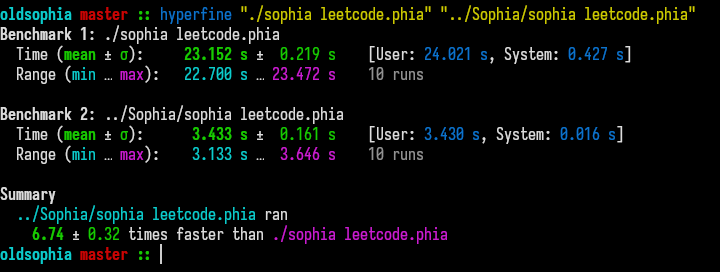
Compared to a ~4x improvement a ~7x improvement is a lot more impressive.